image

Hello, I am
Gbolahan.

A Data Visualization Developer with a passion for transforming complex data sets into clear, visually stunning insights.

As a Data Visualization Developer, I leverage tools like Tableau, SQL, and Excel to reveal the true meaning behind the numbers. My work goes beyond presenting data; it’s about crafting compelling stories that drive action and inspire change.

About Me.

My Skills

  • Tableau (Expert)
  • Proficient in Tableau Desktop, Tableau Cloud/Server, and Tableau Prep.
    Extensive experience in creating dynamic dashboards and data visualizations.
    Skilled in advanced analytics, data blending, and complex calculations.
  • SQL (Advanced)
  • Strong ability to write and optimize complex queries for data extraction and analysis.
    Experience with various SQL databases to manage and manipulate large datasets.
  • Excel (Expert)
  • Advanced proficiency in data analysis, pivot tables, and complex formula creation.
    Skilled in data visualization using charts and graphs, as well as in automation using VBA.
  • Figma (Advanced)
  • Proficient in using Figma for prototyping and wireframe design. Strong skills in creating interactive and user-friendly UI/UX designs.

With three years of experience as a data visualization developer, I’ve honed my skills in tools like Tableau, SQL, and Excel to reveal the true meaning behind the numbers. My work goes beyond presenting data; it’s about crafting compelling stories that drive action and inspire change.

I am proud to have received 6x Tableau Viz of the Day awards, be a Tableau Featured Author, and win 2x Vizzies awards (Notable Newbie 2023 and Biggest Growth in the Community 2024). In 2023, I was honored to be named a Tableau Public Ambassador. Additionally, one of my visualizations was shortlisted at the Information is Beautiful Awards 2024.

I’m a creative problem-solver dedicated to turning insights into impactful solutions. Explore my portfolio to see how I turn data into stories worth telling. Let’s turn your data into something extraordinary!

Qualifications

Work Experience

  • MAGNiTT
  • Levy Analytics Group
  • Aspire
  • Avatrade Marketplace
  • University of Ilorin

Data Visualization Developer

Dubai, UAE

May 2023 - Present

  • Revitalized the website's Advanced Analytics client dashboard UI, integrating innovative chart initiatives and visualization techniques. This overhaul significantly improved user experience, evidenced by a 50% surge in user engagement.
  • Significantly contributed to transforming quarterly and yearly reports, infusing them with sophisticated visualizations and a design style aligned with our organization's branding, enhancing readability and visual appeal.
  • Played a pivotal role in designing visualizations that illuminated investment trends, providing crucial insights for strategic decision‑making by the senior leadership team.

Tableau Developer

Miami, Florida

May 2023· Full-time

  • Crafted a detailed healthcare dashboard, leading to a 20% improvement in patient data management efficiency and a 15% increase in accurate insurance tracking for a major hospital.
  • Developed and refined a suite of interactive dashboards for Levy Analytics' portfolio, showcasing diverse data visualization capabilities, contributing to a 25% increase in client engagement and inquiries.
  • Engineered a sophisticated dashboard for a multi‑branch restaurant chain, resulting in a 30% boost in identifying revenue‑generating opportunities and pinpointing underperforming assets for strategic improvements.

Tableau Consultant

Singapore, Singapore

Jul 2023 - Dec 2023 · Full-time

  • Led the overhaul of Aspire's data models, achieving a 30% increase in process efficiency and enhancing data security. Implemented comprehensive PII and access controls, ensuring 100% compliance with regulatory standards and supporting scalable data architecture
  • Played a crucial role in the transition from Periscope to Tableau Cloud, significantly involved in migrating data and dashboards. This effort led to a marked improvement in analytics functionality, with a 20% increase in report generation speed and a 30% enhancement in user transition to the new platform.
  • Redesigned key dashboards, improving their clarity and performance by 35%. Established design guidelines and templates, standardizing best practices in dashboard creation and contributing to a 30% increase in visualization process efficiency.

Data Analyst

Miami, Florida

Oct 2021 - Dec 2022 · Full-time

  • Analyzing historical data and creating accurate dashboards and reports to improve the decision‑making of customer success, product, and marketing teams.
  • Developing business KPI dashboards in Tableau that report real‑time business metrics, track customer base growth, and push improved business decisions by stakeholders by 50%.
  • Enhancing marketplace performance by 45% through the use of Google Analytics to understand customer behavior from ad campaigns in 6 months

Data Entry and Research Analyst Intern

Ilorin, Kwara

Feb 2020 - Jul 2020 · Full-time
  • Analyzed and identified top targets through analytical and critical thinking to improve internet connectivity and improve user experience by 10%
  • Reviewed dashboards regularly to evaluate KPIs and identify performance trends in the first 6 weeks
  • Data‑driven recommendations were presented to the stakeholders to solve problems faced by the organization within 3 months of joining.

Education

  • University of Ilorin - Bachelor of Science
  • • Computer Science - BS
    • 2017 - 2021
  • Tableau Desktop Specialist
  • • Certificate
    • 2023 - Present
  • Tableau Public Ambassador 2023
  • • Certificate
    • 2023 - 2024

Volunteering

  • Tableau Trainer/Tutor
    • HerTech Trails Foundation
    • 03/2023 - Present
  • Volunteer Editor, Nightingale Magazine
    • Data Visualization Society
    • 01/2023 - Present
  • Data Analytics Trainer
    • Data Analytics Trainer
    • 10/2022 - Present

Projects.

image

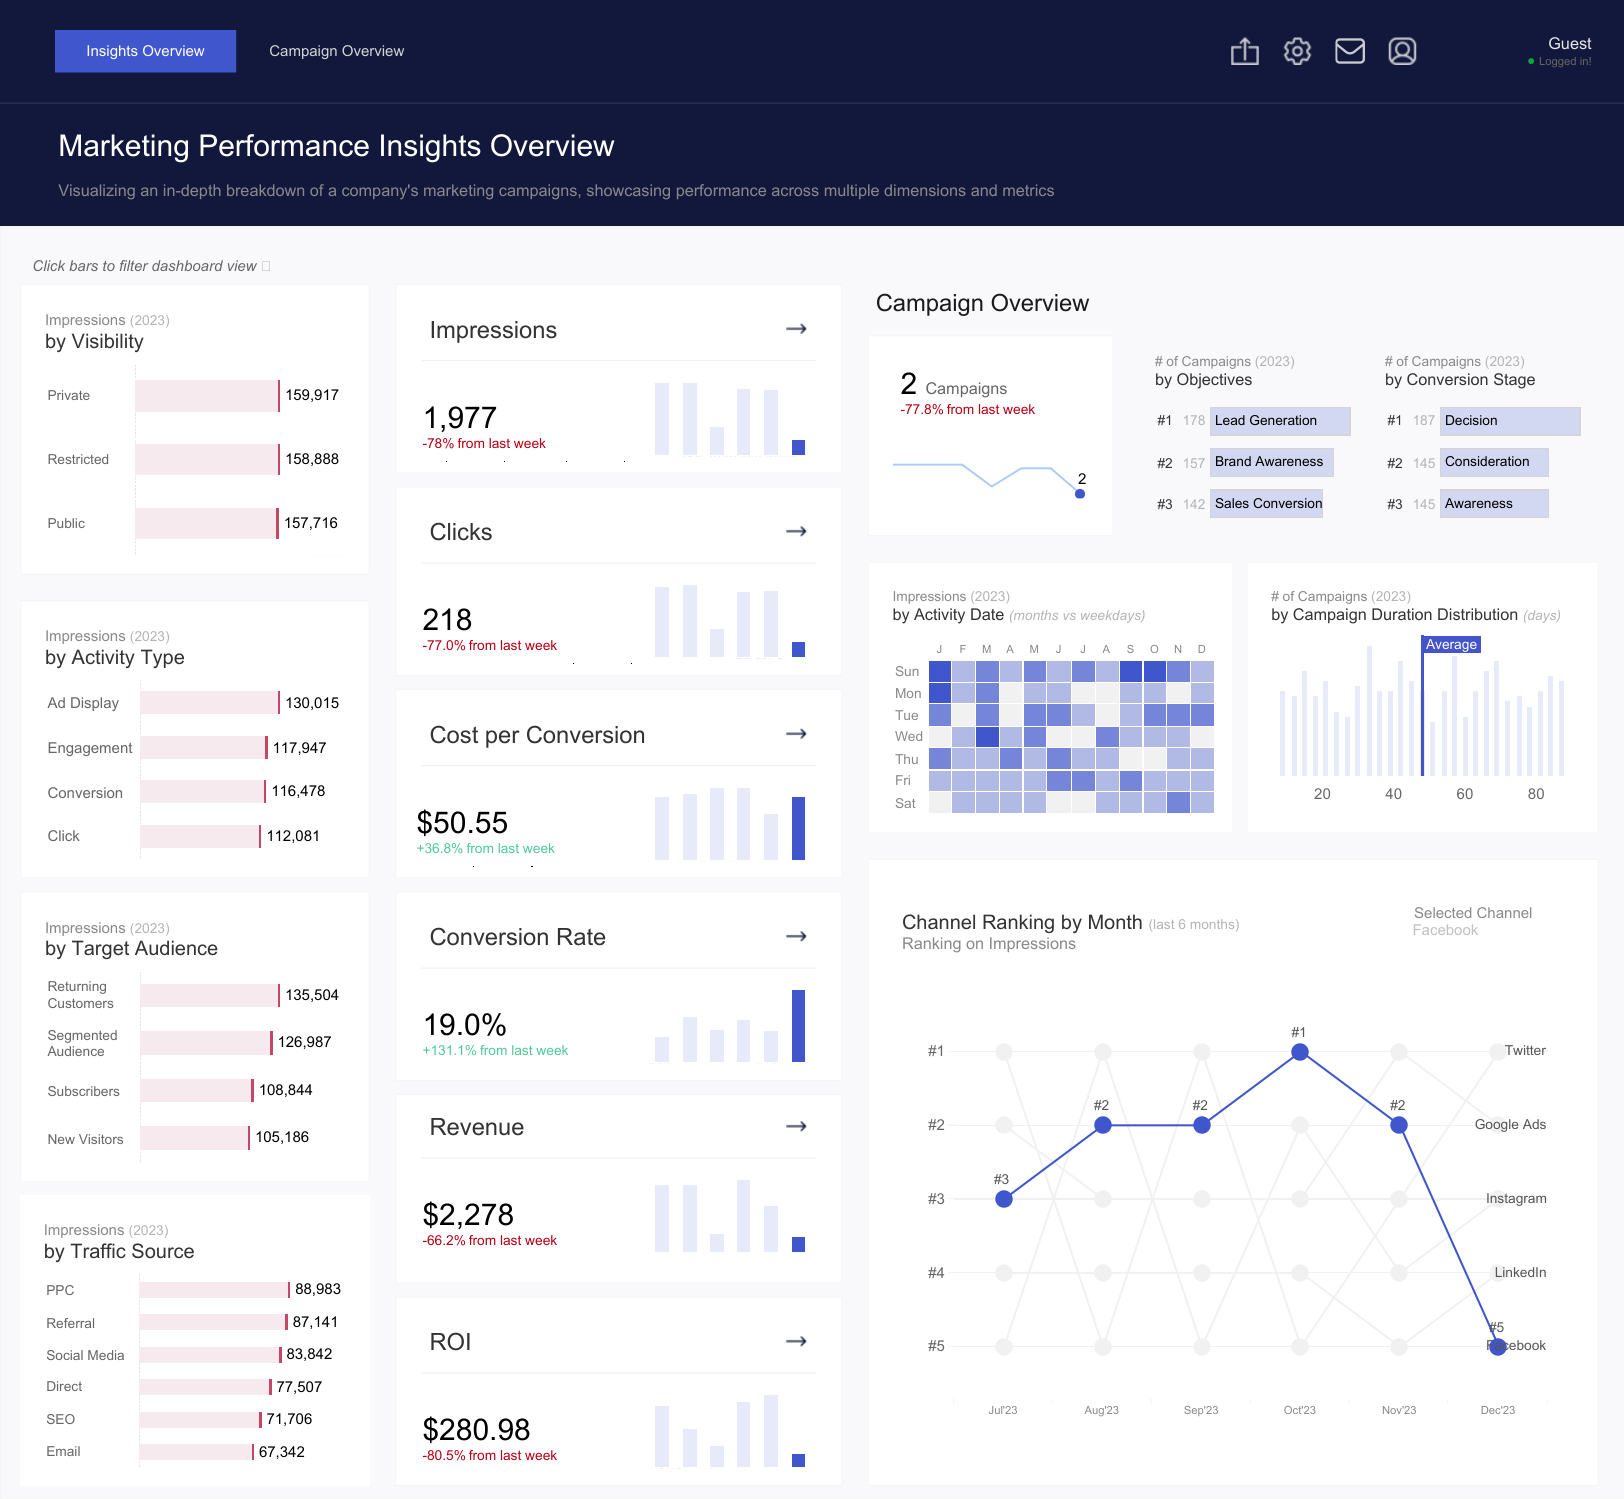
Marketing Campaign Performance Dashboard

The Marketing Campaign Performance Dashboard provides an overview of various marketing campaign metrics. It includes insights on key performance indicators (KPIs) such as conversion rates, customer acquisition costs, and return on investment (ROI).
image

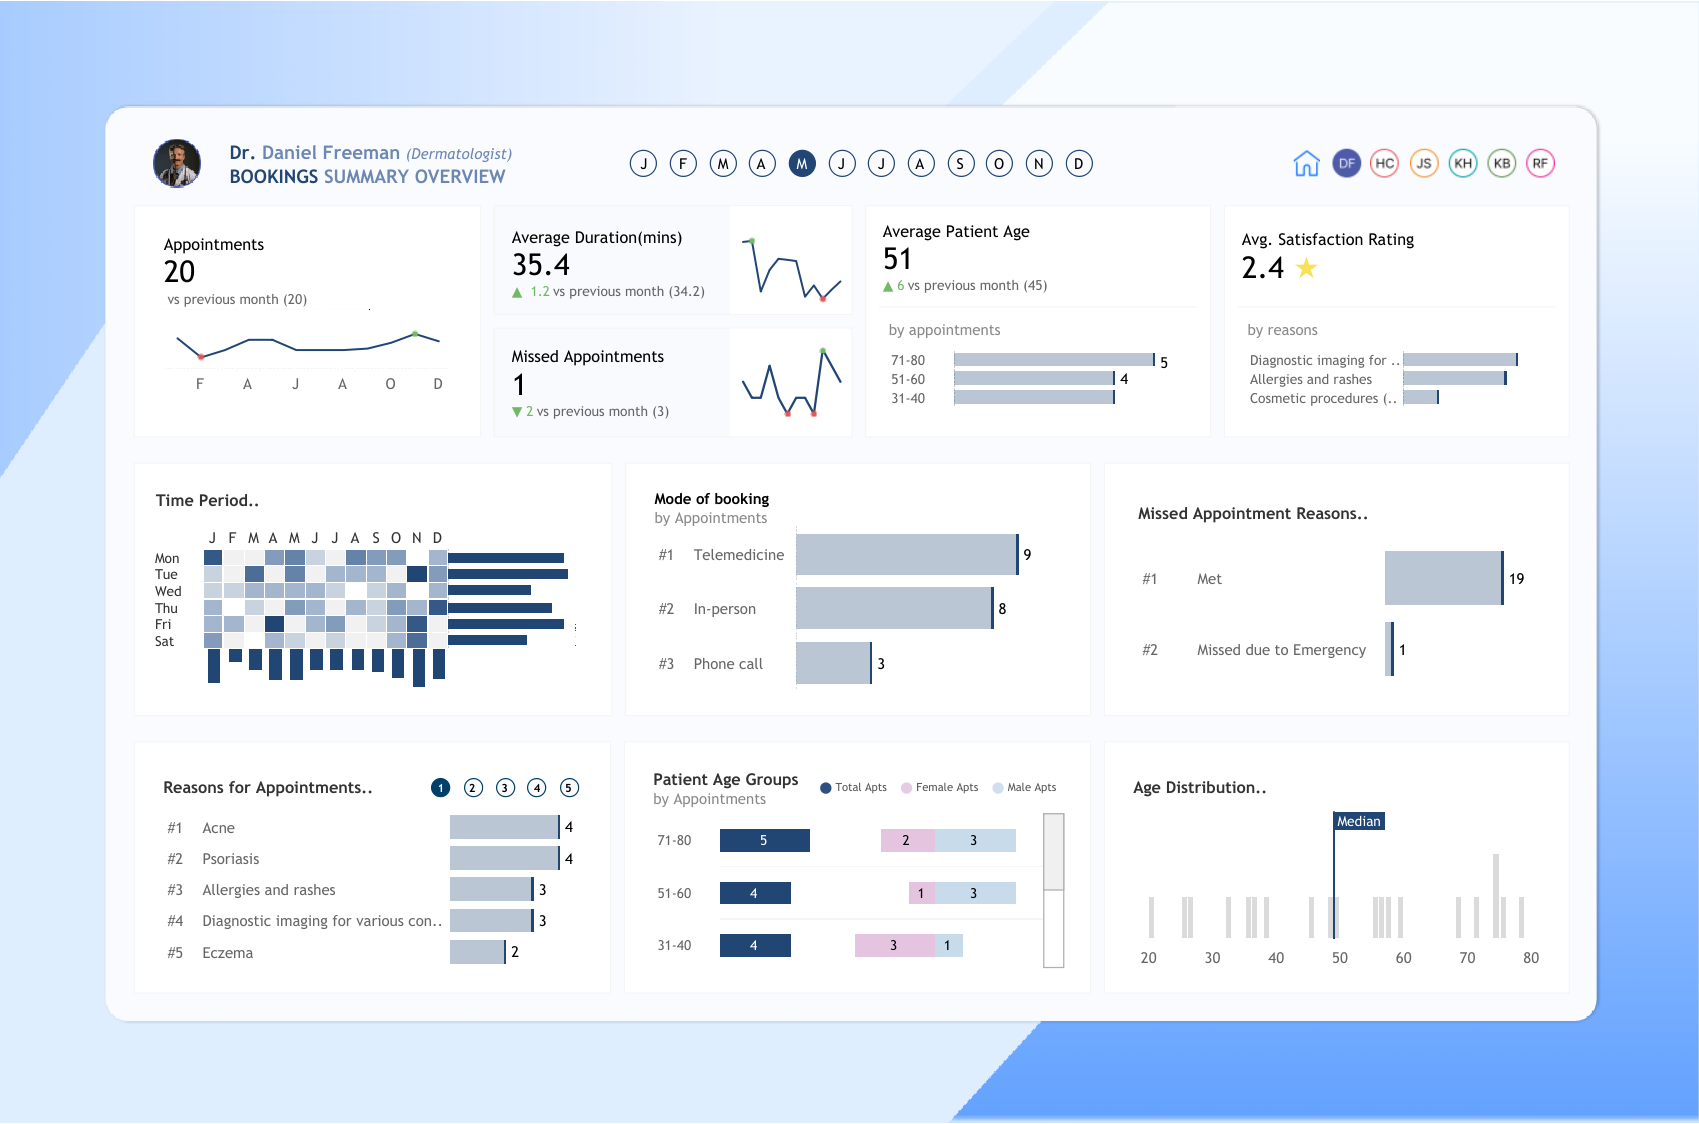
Doctor Appointment Summary Dashboard

This dashboard offers a comprehensive analysis of doctor appointments. It includes metrics such as the total number of appointments, cancellations, and no-shows, with visualizations like line charts and heat maps to highlight trends over time.
image

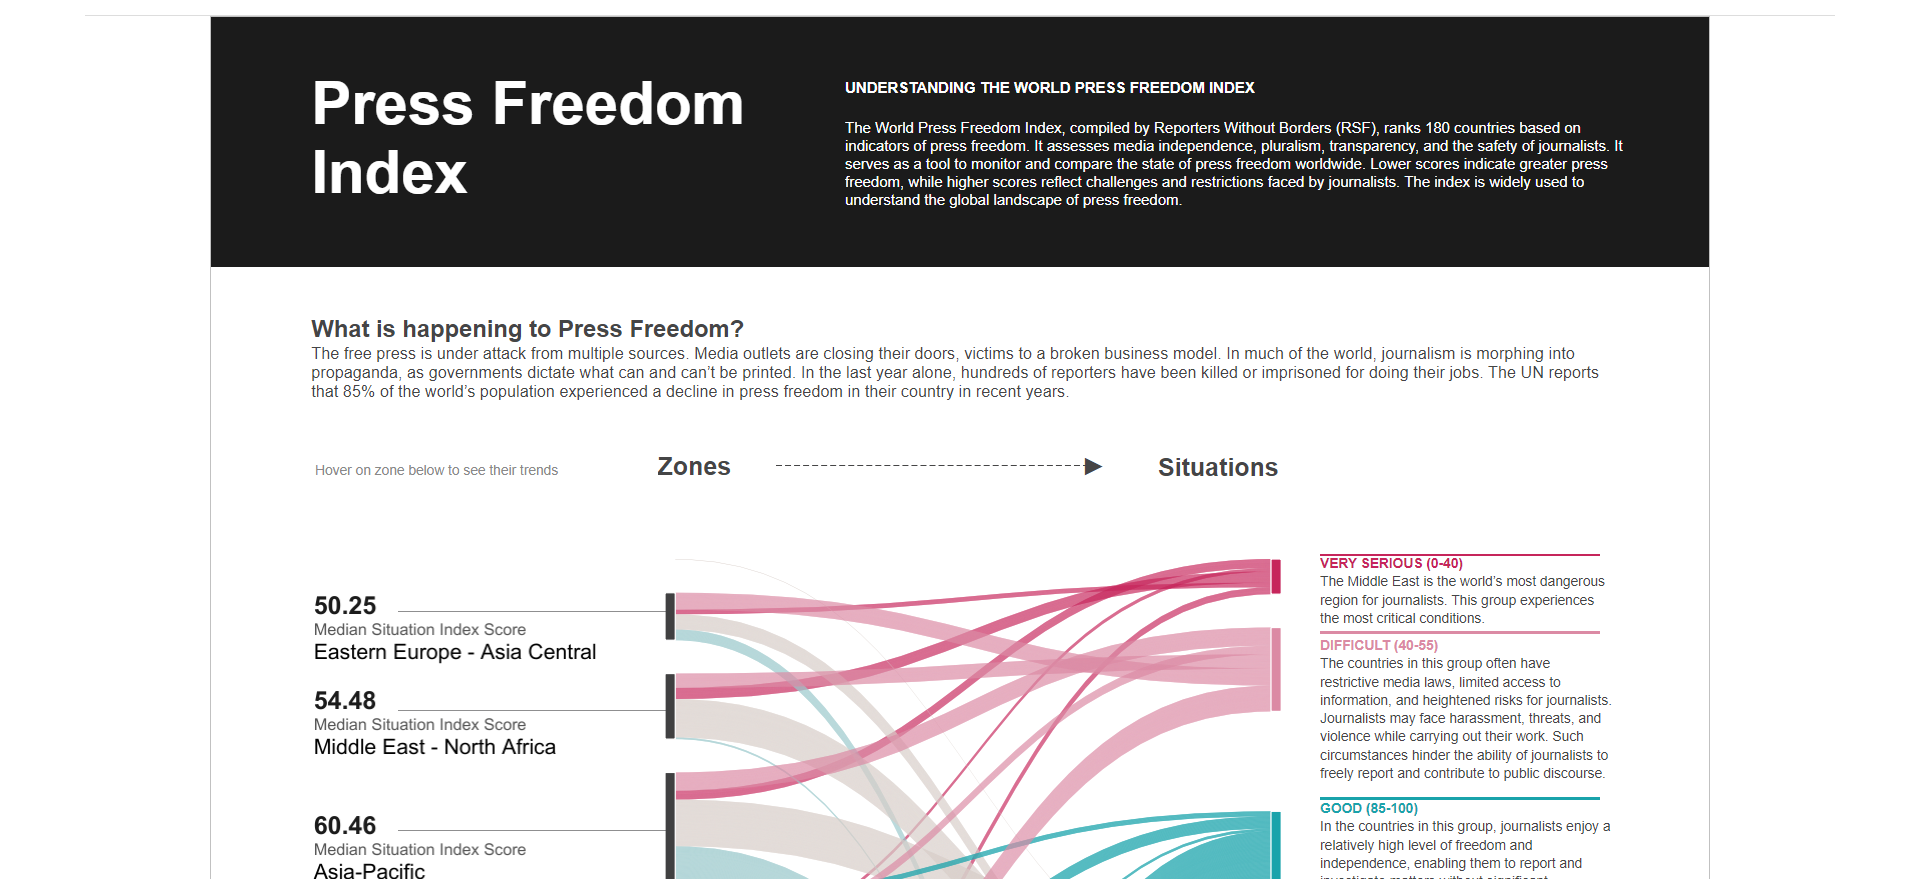
Press Freedom Index

This dashboard visualizes global data on press freedom, displaying scores and rankings for various countries. It features maps, bar charts, and trend lines to illustrate the levels of press freedom, including indicators like legal framework, political environment, and economic pressures on media.
image

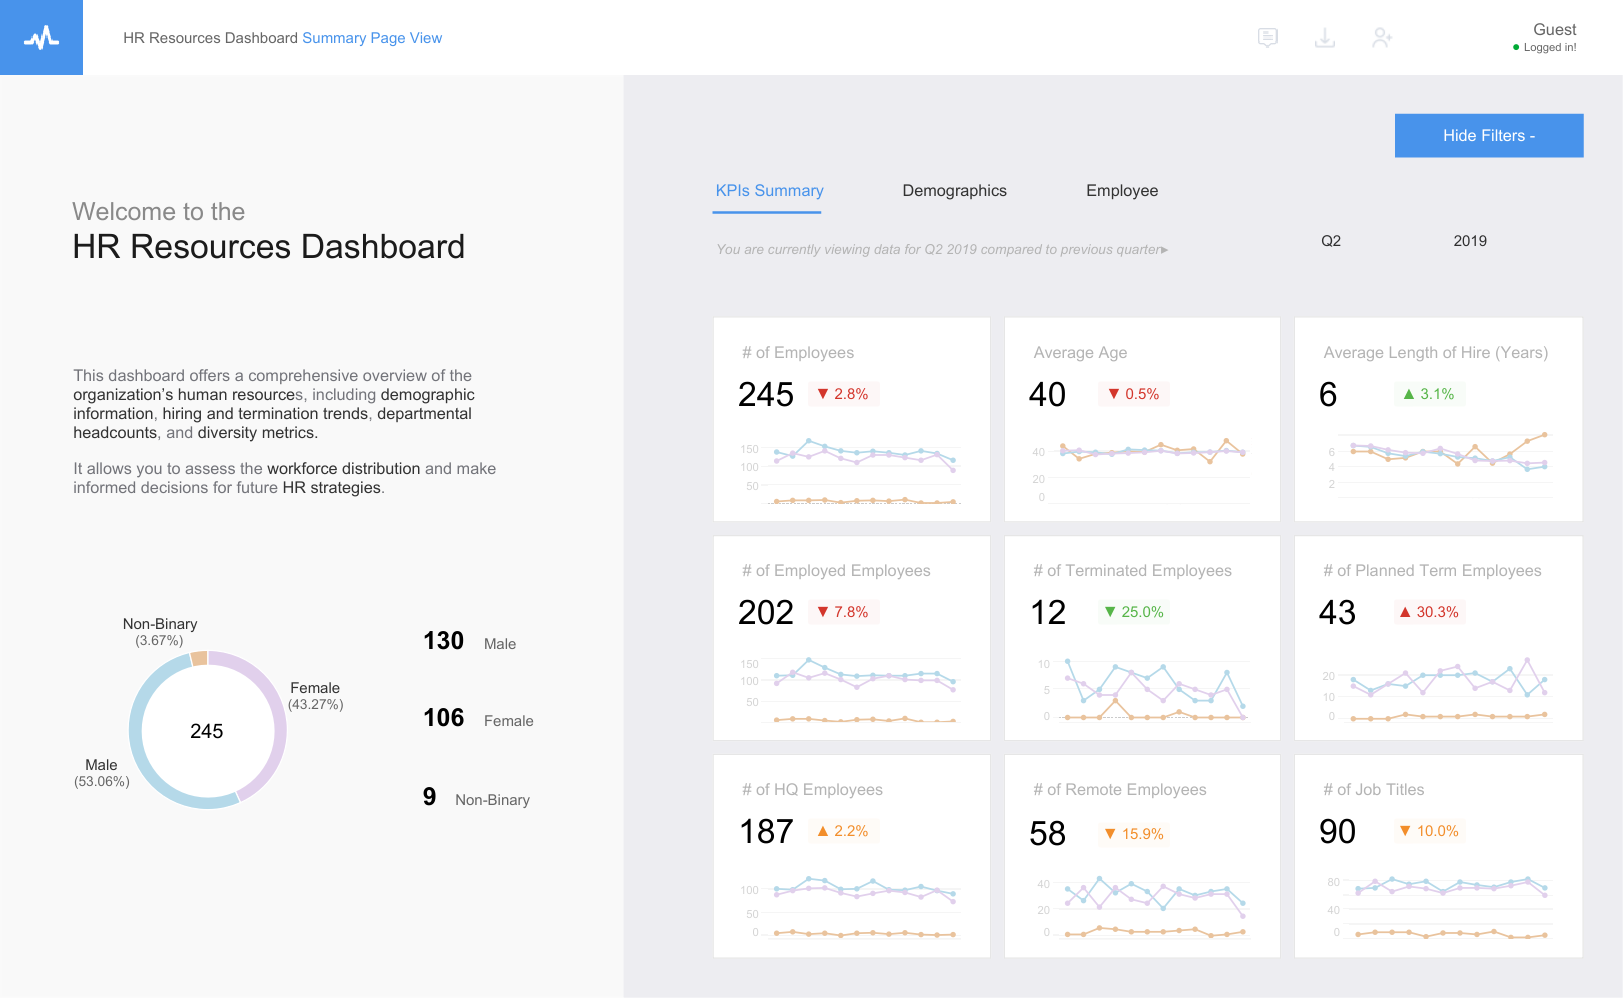
HR Resources Dashboard

This dashboard presents key HR metrics, including employee turnover rates, hiring statistics, diversity metrics, and employee satisfaction scores. It uses various visualizations like pie charts, bar graphs, and trend lines to track workforce dynamics.
image

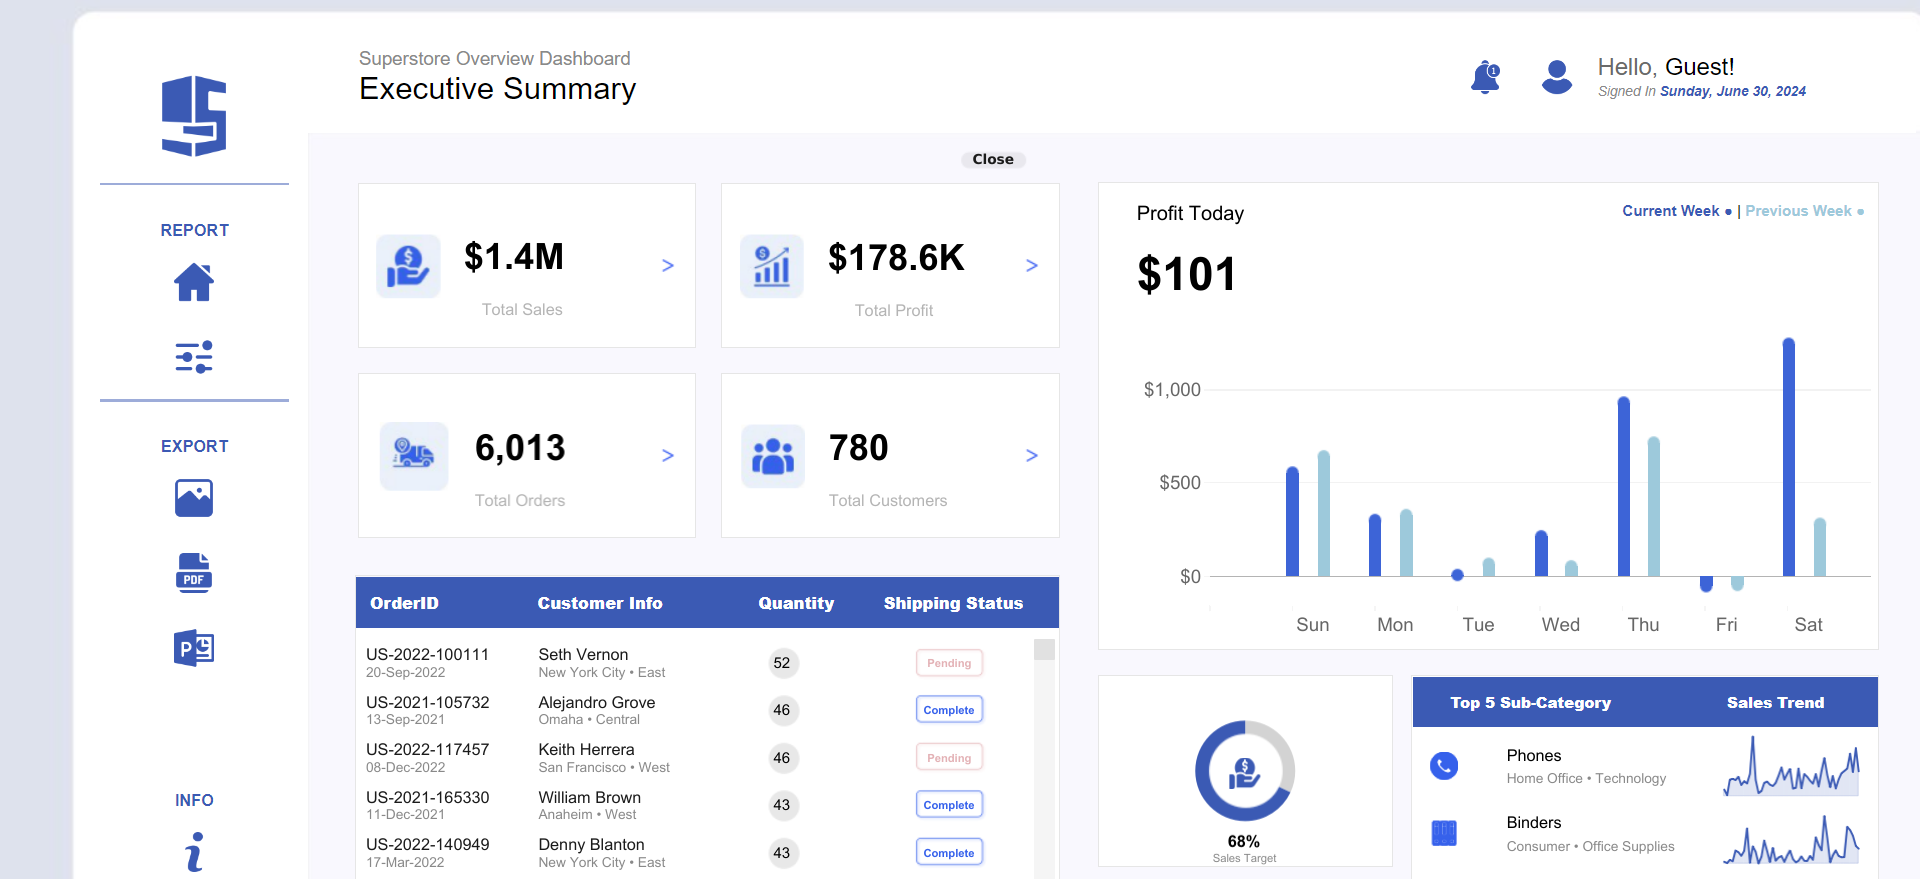
SuperStore Dashboard

This dashboard analyzes sales data from a retail superstore, offering insights into sales performance, profit margins, and product category performance. Visualizations such as bar charts, line graphs, and maps display data on sales by region, product category, and time period.
image

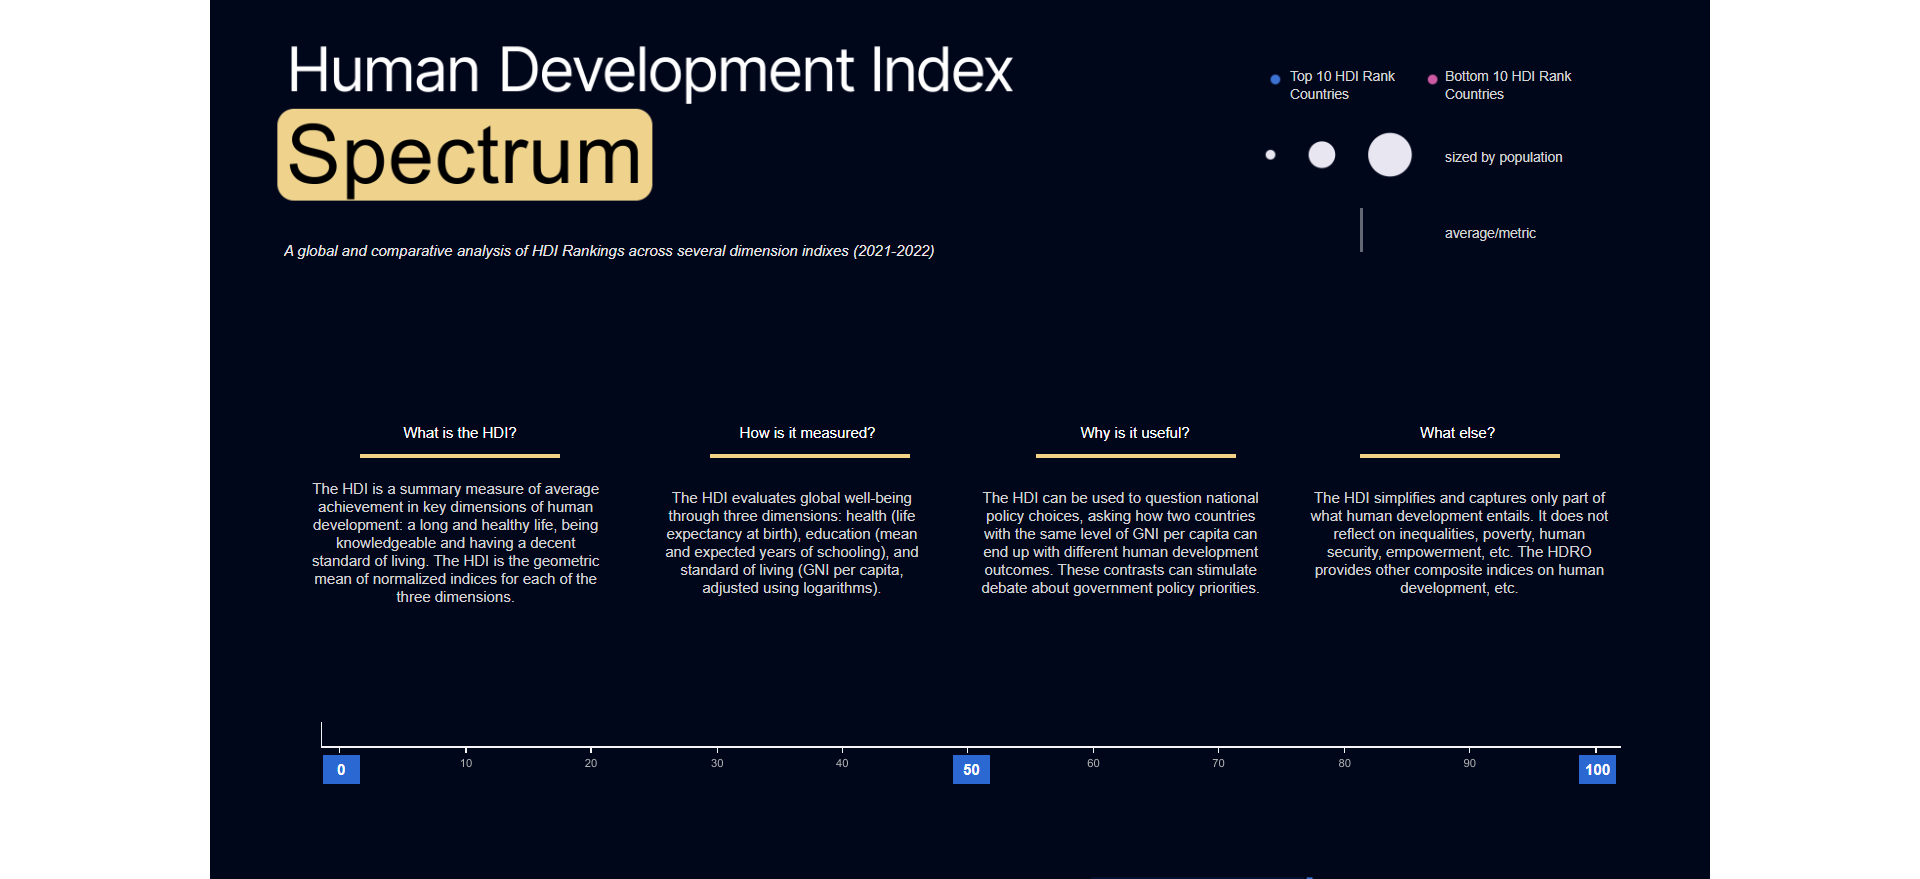
Global Human Development Index Spectrum

The Human Development Index (HDI) Spectrum Rankings Dashboard presents a comprehensive analysis of HDI scores and rankings for various countries. The dashboard includes visualizations such as bar charts and maps to compare countries based on their HDI components: life expectancy, education level, and per capita income.

Send Me A Message